
Cabacungan
Municipality of Dulag
Province of Leyte
Cabacungan is a barangay in the municipality of Dulag, in the province of Leyte. Its population as determined by the 2020 Census was 3,362. This represented 6.86% of the total population of Dulag.
| Type | barangay |
|---|---|
| Island group | Visayas |
| Region | Eastern Visayas (Region VIII) |
| Province | Leyte |
| Municipality | Dulag |
| Postal code | 6505 |
| Population (2020) | 3,362 |
| Philippine major island(s) | Leyte |
| Coordinates | 10.9331, 124.9833 (10° 56′ North, 124° 59′ East) |
| Estimated elevation above sea level | 13.3 meters (43.6 feet) |
History
The barangay is the smallest political unit in the Philippines. Each municipality or city is therefore made up of barangays.
The barangay government unit is composed of elective officials called the Punong Barangay who is the chief executive, the Sangguniang Barangay members, also called Kagawads, and the Sangguniang Kabataan Chairman. The appointive officials are the barangay Secretary, the barangay Treasurer, the members of the Lupong Tagapamayapa, and the barangay Tanods.
The primary requisite for the creation of a barangay is a population of at least 2,000. But for highly urbanized cities, a minimum of 5,000 inhabitants is required. The creation of a barangay is done by law or an ordinance of the Sangguniang Panlalawigan or Sangguniang Panlungsod, and has to be ratified by the affected voting population through a plebiscite.
Demographics
Households
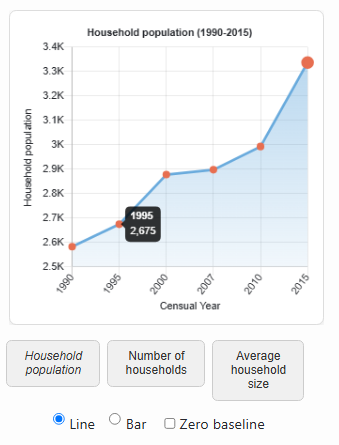
The household population of Cabacungan in the 2015 Census was 3,337 broken down into 811 households or an average of 4.11 members per household.
Trends in household population and size
| Census date | Household population | Number of households | Average household size |
|---|---|---|---|
| 2,583 | 516 | 5.01 | |
| 2,675 | 550 | 4.86 | |
| 2,878 | 577 | 4.99 | |
| 2,898 | 600 | 4.83 | |
| 2,993 | 660 | 4.53 | |
| 3,337 | 811 | 4.11 |
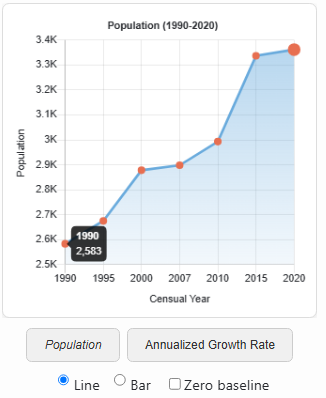
Historical population
The population of Cabacungan grew from 2,583 in 1990 to 3,362 in 2020, an increase of 779 people over the course of 30 years. The latest census figures in 2020 denote a positive annualized growth rate of 0.16%, or an increase of 25 people, from the previous population of 3,337 in 2015.
Trends in population growth
| Census date | Population | Annualized Growth Rate |
|---|---|---|
| 2,583 | – | |
| 2,675 | 0.66% | |
| 2,878 | 1.58% | |
| 2,898 | 0.10% | |
| 2,993 | 1.18% | |
| 3,337 | 2.09% | |
| 3,362 | 0.16% |
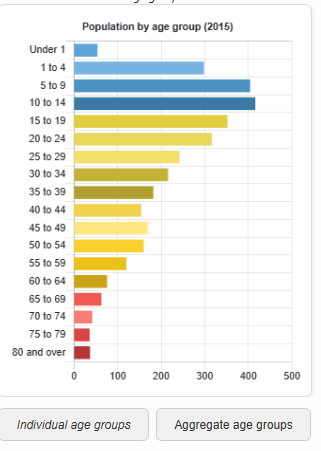
Population by age group
According to the 2015 Census, the age group with the highest population in Cabacungan is 10 to 14, with 416 individuals. Conversely, the age group with the lowest population is 75 to 79, with 36 individuals.
Age distribution
Combining age groups together, those aged 14 and below, consisting of the young dependent population which include infants/babies, children and young adolescents/teenagers, make up an aggregate of 35.12% (1,172). Those aged 15 up to 64, roughly, the economically active population and actual or potential members of the work force, constitute a total of 59.54% (1,987). Finally, old dependent population consisting of the senior citizens, those aged 65 and over, total 5.33% (178) in all.
The computed Age Dependency Ratios mean that among the population of Cabacungan, there are 59 youth dependents to every 100 of the working age population; there are 9 aged/senior citizens to every 100 of the working population; and overall, there are 68 dependents (young and old-age) to every 100 of the working population.
The median age of 22 indicates that half of the entire population of Cabacungan are aged less than 22 and the other half are over the age of 22.
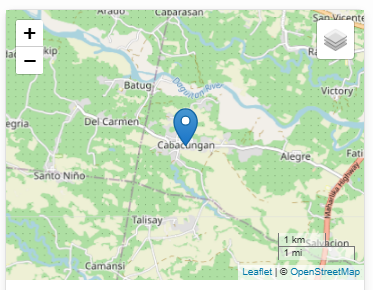
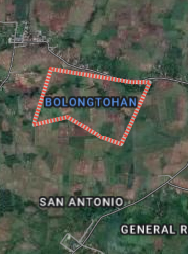
Location
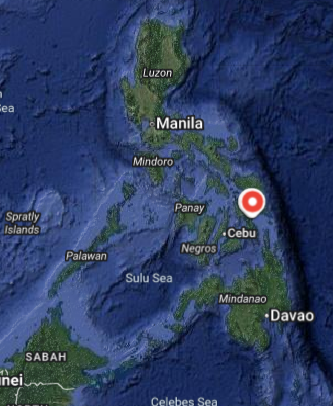
Cabacungan is situated at approximately 10.9331, 124.9833, in the island of Leyte. Elevation at these coordinates is estimated at 13.3 meters or 43.6 feet above mean sea level.
References
1. Cabacungan, Dulag, Leyte Profile – PhilAtlas. (1990, May). Philatlas.com. https://www.philatlas.com/visayas/r08/leyte/dulag/cabacungan.html
2. PhilAtlas. (n.d.). Barangays – PhilAtlas. Www.philatlas.com. https://www.philatlas.com/barangays.html
Cabacungan |
|
|---|---|
| Barangay | |
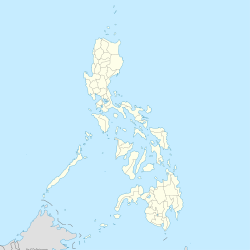
 Map of Dulag with Cabacungan highlighted |
|
| Age group | Population (2015) | Age group percentage |
|---|---|---|
| Under 1 | 54 | 1.62% |
| 1 to 4 | 298 | 8.93% |
| 5 to 9 | 404 | 12.11% |
| 10 to 14 | 416 | 12.47% |
| 15 to 19 | 352 | 10.55% |
| 20 to 24 | 316 | 9.47% |
| 25 to 29 | 242 | 7.25% |
| 30 to 34 | 216 | 6.47% |
| 35 to 39 | 182 | 5.45% |
| 40 to 44 | 154 | 4.61% |
| 45 to 49 | 169 | 5.06% |
| 50 to 54 | 160 | 4.79% |
| 55 to 59 | 120 | 3.60% |
| 60 to 64 | 76 | 2.28% |
| 65 to 69 | 63 | 1.89% |
| 70 to 74 | 42 | 1.26% |
| 75 to 79 | 36 | 1.08% |
| 80 and over | 37 | 1.11% |
| Total | 3,337 | 100.00% |
|
||
Cabacungan – Places to Go
- Posts not found
Other Places to Go
- Posts not found